Features.

Evaluate & Analyse

Aggregate data from multiple connected points

Ki. unlocks unique urban data, from multiple connected points, to keep you better informed about the real challenges on the street, which can be tailored to meet your smart city goals.

Keep check of operational efficiencies and adjust single profiles or asset groups according to the results, via the Ki. platform. Evaluate unique details of all assets, from single streetlights or groups to the entire network, to ensure performance matches requirements and analyse the impact when adjustments are made, using the reporting dashboard.

This is possible via the following features:

Individual Asset Status

Understand the status of individual assets and their performance. Monitor connection status and other energy variables to ensure smart city infrastructure is behaving as expected. Capture and review the following information:

  • Luminaire Status (on/off/dimmed %).
  • Column Door Status.
  • Communication Connection Status (part of defect / error events).
  • Column and Luminaire Alignment.
  • Fault Condition and Full History.
  • Last Gasp Power Monitoring.
  • Column Temperature.
  • Bluetooth Smart City Connected Sensor Status.
  • Connection: provides colour coded status of connection.
  • DALI 1 and 2 reporting and control.
  • Elexon Energy Consumption Data.
  • Standby Power.
  • Power Factor.

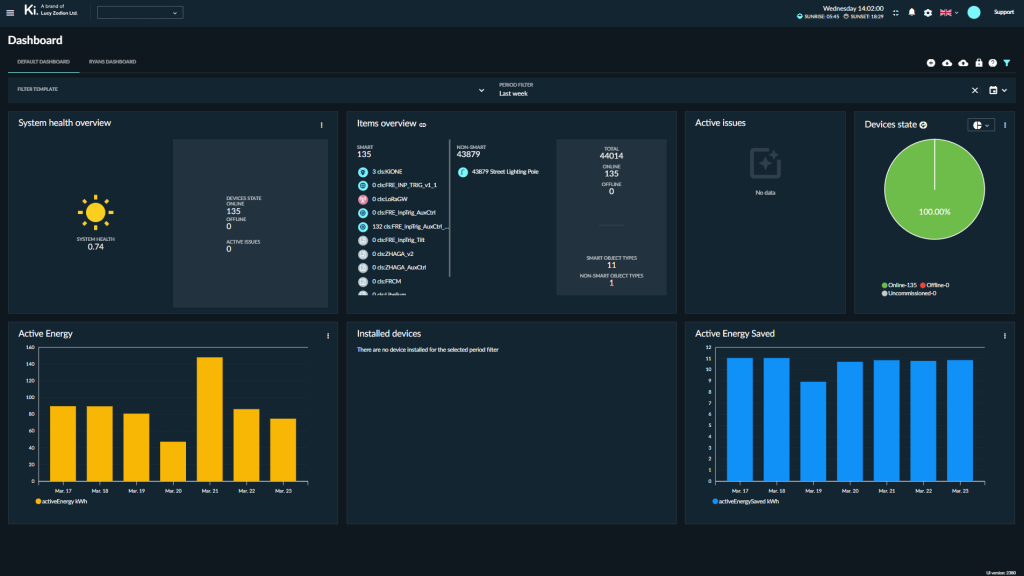
Ecosystem Reporting Dashboard

Ki.’s reporting dashboard aids you in assessing the overall performance of your ecosystem. With a dedicated reporting dashboard, you have the freedom to evaluate and analyse a wide range of data sets from one place, in the context of your smart city. Features include:

  • System health score checker to assess overall status of the ecosystem using at-a-glance colour coded indicators.
  • Check communications strength over a 24 hour period.
  • Evaluate number of commissioned nodes or assets within the entire ecosystem.
  • Review recent faults over 24 hour, 7 day and 30 day periods.
  • Review faults by category and severity to pin point common issues throughout the scheme.


Fault Reporting Dashboard

Evaluate performance variables, such as faults, via the Fault Reporting Dashboard. Configurable to report over specific timescales, faults can be assessed by category and severity with data presented in a simple colour coded donut. Other features include:

  • Understand the root of common faults using the ‘Faults by Category’ indicator, to pin point issues at source.
  • Where the issue sits with the node, the ‘Node Fault Severity’ tracker breaks data down further into severity to enable informed action plan.
  • Presets can be set so information is presented either by node count or percentage of total nodes, for tailored reporting.
  • Contextualise faults within your smart city ecosystem using the map to cross-reference against data, for location based insights.
  • Fault data can be interrogated further using the Report filters for tailored insights based on your smart city goals.
  • Export results to CSV for internal referencing and informed maintenance planning.

Energy Consumption Dashboard

The Energy Consumption Dashboard analyses energy use and evaluates the data generated in an interactive graph. Choose from a number of filtering options to pin point areas and timescales of interest for in-depth insights into the efficiency of your smart city ecosystem. Features of the Energy Consumption Dashboard include:

  • Filter results against specific dates or preset ranges to drill down data.
  • Assess power usage throughout hourly, daily, weekly or monthly periods.
  • Consumption is monitored and reported in kWh.
  • Energy consumption data can be interrogated further using the report filters for tailored insights based on your energy efficiency goals.
  • Export results to CSV for internal referencing and informed maintenance planning.